
GCSE Combined Science (AQA)
622 videos | 38 hours
Please subscribe to watch this video.
This, and all other videos, are included in our premium subscriptions.
Premium accounts get access to all videos.
Enable autoplay to keep watching
Your browser is blocking videos from playing automatically. To turn it back on:
Safari (Mac): Click the Safari menu item in the top bar, then Settings → Websites → Auto-Play, then set Auto-Play to Allow All Auto-Play for the current website.
Safari (iPhone/iPad): open the Settings app, then Apps → Safari → Auto-Play, and select Allow All Auto-Play.
Accelerating Distance-Time Graphs
- Distance-time graph of an accelerating object is curved.
- The gradient of the graph equals the object's speed.
- A curving upwards graph indicates increasing speed and acceleration.
- A curving downwards graph indicates deceleration.
- Changing gradient shows changing speed.
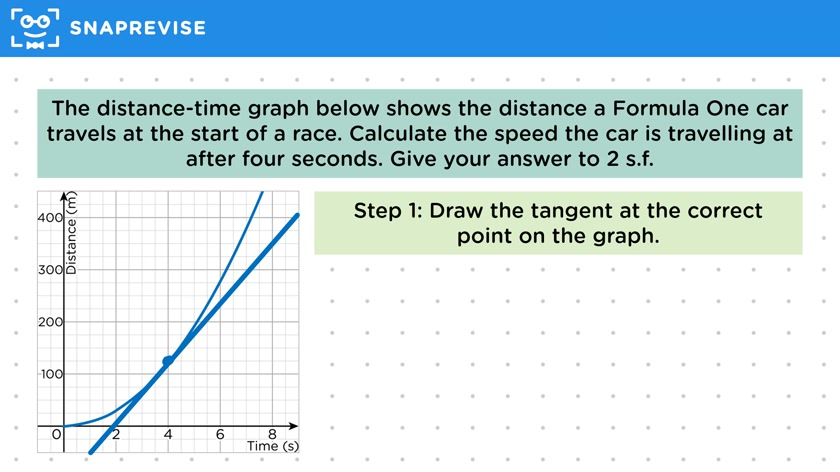
- Speed at a point is determined by the gradient of the tangent to the curve at that point.
- Instantaneous speed is the gradient of the tangent at a specific point in time.
- Average speed calculation is not required for GCSE physics.
- Example: Calculate speed of a Formula One car after four seconds using a tangent.
- Steps to calculate speed:
- 1. Draw tangent at the correct point on the graph.
- 2. Choose two suitable points on the tangent.
- 3. Find the difference between the two distances.
- 4. Find the difference between the two times.
- 5. Divide the difference in distance by the difference in time to get the gradient.
- 6. Round to two significant figures.
- Example result: 58 meters per second after rounding.
Please subscribe to access these revision notes.
This, and all other video notes, are included in our premium subscriptions.
Premium accounts get access to all videos and revision notes.
114
questions for Forces
95
questions for Forces and motion