
GCSE Combined Science (AQA)
622 videos | 38 hours
Please subscribe to watch this video.
This, and all other videos, are included in our premium subscriptions.
Premium accounts get access to all videos.
Enable autoplay to keep watching
Your browser is blocking videos from playing automatically. To turn it back on:
Safari (Mac): Click the Safari menu item in the top bar, then Settings → Websites → Auto-Play, then set Auto-Play to Allow All Auto-Play for the current website.
Safari (iPhone/iPad): open the Settings app, then Apps → Safari → Auto-Play, and select Allow All Auto-Play.
Counting Squares Estimation
- In a velocity-time graph, each square represents a set distance traveled.
- The graph shows how the velocity of an object changes over a journey.
- The gradient of the graph indicates the object's acceleration.
- The area under the graph represents the distance traveled, calculated by multiplying velocity by time.
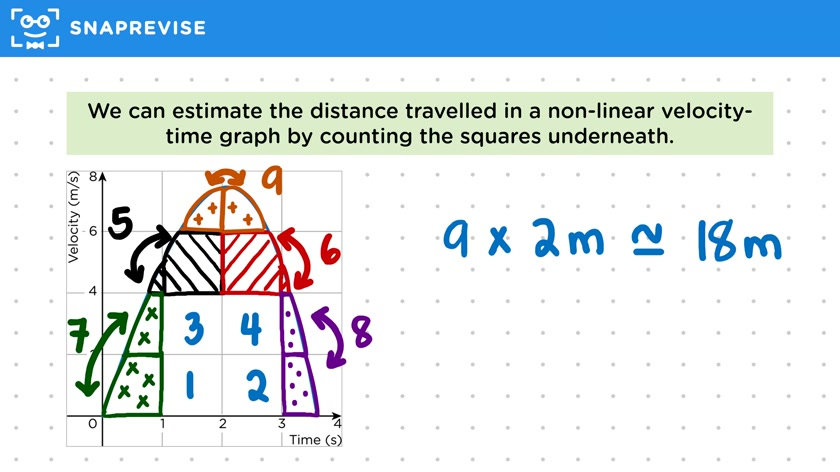
- For non-linear graphs, estimate the distance by counting squares under the graph.
- For straight-line graphs, split the area into rectangles and triangles for calculation.
- For curved graphs, estimate the area using an approximation method.
- Count full squares and estimate partial squares by grouping them into full squares.
- Calculate the total distance by multiplying the number of squares by the distance each square represents.
- Example: A paper airplane's velocity-time graph is used to estimate the distance traveled before stopping.
- Determine the area represented by one square using the graph's scale.
- Count full squares and estimate partial squares under the graph.
- Calculate the total distance by adding the number of full and estimated squares and multiplying by the distance each square represents.
- Ensure reasoning is clear and within an acceptable range for exam questions.
Please subscribe to access these revision notes.
This, and all other video notes, are included in our premium subscriptions.
Premium accounts get access to all videos and revision notes.
114
questions for Forces
95
questions for Forces and motion