
GCSE Combined Science (AQA)
622 videos | 38 hours
Please subscribe to watch this video.
This, and all other videos, are included in our premium subscriptions.
Premium accounts get access to all videos.
Enable autoplay to keep watching
Your browser is blocking videos from playing automatically. To turn it back on:
Safari (Mac): Click the Safari menu item in the top bar, then Settings → Websites → Auto-Play, then set Auto-Play to Allow All Auto-Play for the current website.
Safari (iPhone/iPad): open the Settings app, then Apps → Safari → Auto-Play, and select Allow All Auto-Play.
Distance-Time Graphs
- A distance-time graph shows how far an object moves over time.
- The Y-axis represents distance in meters, and the X-axis represents time in seconds.
- Distance-time graphs can describe various situations, such as car journeys or races.
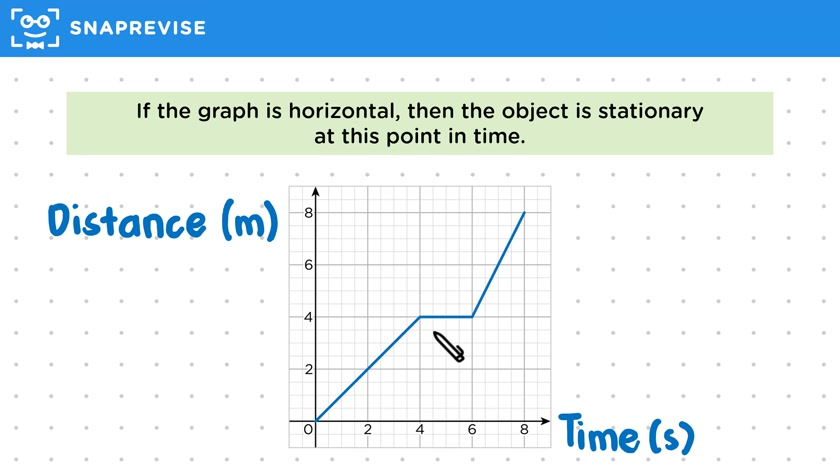
- Example: A helicopter rising into the air, initially rising slowly, then staying at the same height, and finally rising quickly.
- The Y-axis can also represent horizontal distance, not just height.
- In exams, you may describe journeys in words or be given numerical data in tables.
- Reading a graph involves looking at X and Y values at a point; Y value shows distance traveled, X value shows time taken.
- Example: Helicopter traveled 2 meters in 2 seconds, 6 meters in 7 seconds.
- The steeper the gradient, the faster the object is moving.
- A horizontal graph section indicates the object is stationary.
- In exams, describe motion shown in a distance-time graph qualitatively.
- Example: Describe the motion of a herd of wildebeest over one hour using a distance-time graph.
- Describe each section of the graph individually:
- First section: Herd travels 24 kilometers in 20 minutes.
- Second section: Herd slows down, travels 6 kilometers in 15 minutes.
- Final section: Herd is stationary for the remaining time.
- Ensure to use the units given on the graph axes.
- Provide detailed descriptions if time allows and avoid mistakes for better exam performance.
Please subscribe to access these revision notes.
This, and all other video notes, are included in our premium subscriptions.
Premium accounts get access to all videos and revision notes.
114
questions for Forces
95
questions for Forces and motion