
GCSE Combined Science (AQA)
622 videos | 38 hours
Please subscribe to watch this video.
This, and all other videos, are included in our premium subscriptions.
Premium accounts get access to all videos.
Enable autoplay to keep watching
Your browser is blocking videos from playing automatically. To turn it back on:
Safari (Mac): Click the Safari menu item in the top bar, then Settings → Websites → Auto-Play, then set Auto-Play to Allow All Auto-Play for the current website.
Safari (iPhone/iPad): open the Settings app, then Apps → Safari → Auto-Play, and select Allow All Auto-Play.
Evolutionary Trees
- Evolutionary trees are diagrams representing relationships between organisms.
- These trees are constructed using data from DNA analysis and fossil records.
- Evolutionary trees are similar to family trees in their formation.
- The fossil record is crucial in showing the extent of change in organisms over time.
- Tips of evolutionary trees represent different species.
- Common ancestors are located at points where two branches join.
- Example: Last common ancestor of chimpanzees and bonobos split around 1.5 to 2 million years ago.
- Humans split from the ancestors of chimps and bonobos more than 4 million years ago.
- Gorillas are more distantly related to chimpanzees and bonobos than humans are.
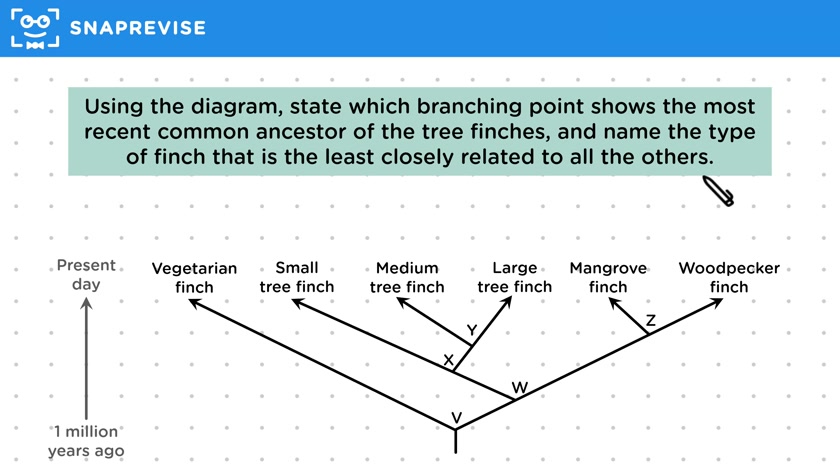
- Diagrams can help identify the most recent common ancestors and the least closely related species.
- Example involving tree finches: Most recent common ancestor is at the junction that connects all tree finches.
- To find the least closely related species, trace back to the first branching point.
- Vegetarian finch is less closely related compared to other finches like the mangrove and woodpecker finch, based on the branching point.
- Understanding evolutionary trees involves interpreting the connections and branches to deduce relationships and common ancestors.
Please subscribe to access these revision notes.
This, and all other video notes, are included in our premium subscriptions.
Premium accounts get access to all videos and revision notes.
81
questions for Inheritance, Variation and Evolution
1
questions for Classification of Living Organisms