
GCSE Combined Science (AQA)
622 videos | 38 hours
Please subscribe to watch this video.
This, and all other videos, are included in our premium subscriptions.
Premium accounts get access to all videos.
Enable autoplay to keep watching
Your browser is blocking videos from playing automatically. To turn it back on:
Safari (Mac): Click the Safari menu item in the top bar, then Settings → Websites → Auto-Play, then set Auto-Play to Allow All Auto-Play for the current website.
Safari (iPhone/iPad): open the Settings app, then Apps → Safari → Auto-Play, and select Allow All Auto-Play.
Incidence of Disease
- Epidemiology studies the distribution and causes of diseases and health issues in populations.
- Epidemiologists study outbreaks of diseases, including global pandemics, and risk factors for non-communicable diseases.
- The incidence of a disease refers to the number of new cases in a population.
- It's essential to translate disease incidence data between graphical and numerical forms and to draw and interpret tables and graphs.
- Various charts and graphs are used to represent disease data, including tables, bar charts, histograms, and connected scatter diagrams.
- Tables show data for different variables; bar charts display information about different categories.
- Histograms show ranges of numbers and are distinguished from bar charts by having adjacent bars.
- Connected scatter diagrams, similar to line graphs, help identify correlations between two variables, and may require drawing a line of best fit.
- Interpreting these charts and graphs is crucial and should be practiced for exams.
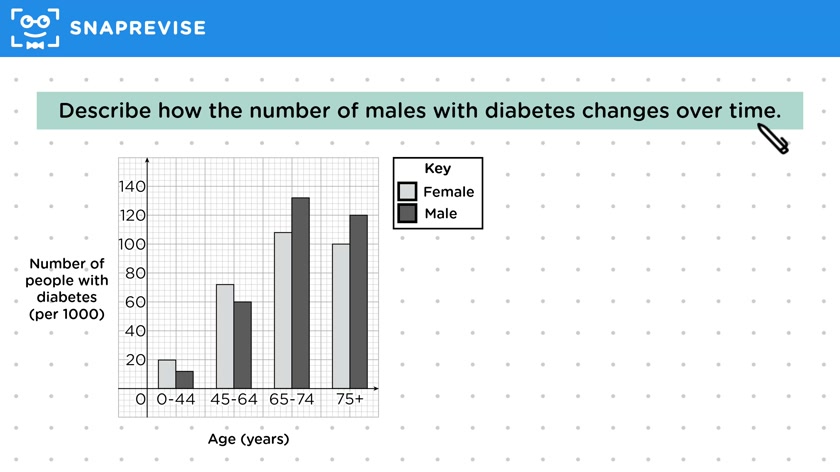
- Example question: Describe how the number of males with diabetes changes over time using a bar chart.
- Steps to interpret the graph include identifying the type of graph, deciding what information the question refers to, identifying the overall trend in the data, and quoting relevant data to justify conclusions.
- The example shows an increase in the number of males with diabetes from the first to the third age category, followed by a decrease.
- The ability to interpret graphs is an important skill for exams.
Please subscribe to access these revision notes.
This, and all other video notes, are included in our premium subscriptions.
Premium accounts get access to all videos and revision notes.
55
questions for Organisation
47
questions for Animal Tissues, Organs and Organ Systems