
GCSE Combined Science (AQA)
622 videos | 38 hours
Please subscribe to watch this video.
This, and all other videos, are included in our premium subscriptions.
Premium accounts get access to all videos.
Enable autoplay to keep watching
Your browser is blocking videos from playing automatically. To turn it back on:
Safari (Mac): Click the Safari menu item in the top bar, then Settings → Websites → Auto-Play, then set Auto-Play to Allow All Auto-Play for the current website.
Safari (iPhone/iPad): open the Settings app, then Apps → Safari → Auto-Play, and select Allow All Auto-Play.
Rate Changes & Graphs
- Graphs visualize how the rate of reaction changes over time.
- Two types of graphs: amount of reactant remaining and amount of product made.
- X-axis represents time since the start of the reaction.
- Y-axis represents the amount of reactant used or product formed.
- Higher graph indicates more reactant left or more product made.
- Rate can be calculated in units like grams per second or centimeters cubed per second.
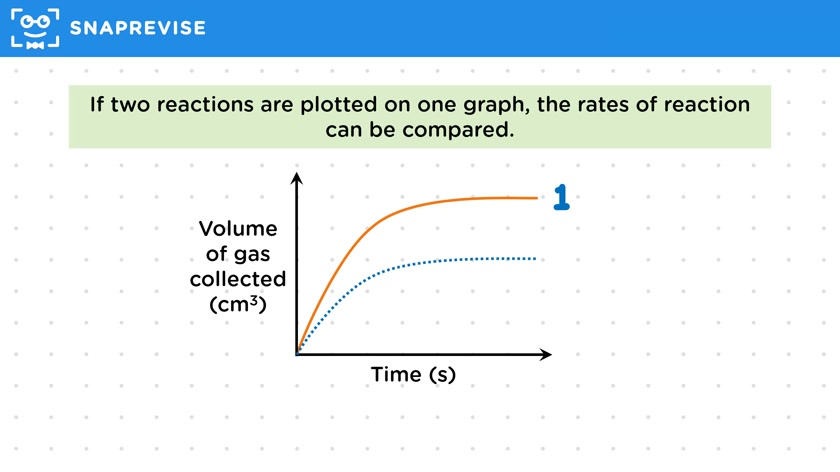
- Steeper line indicates a faster reaction.
- Reactions are fastest at the start due to more reactant particles.
- Reaction slows down as reactants are used up, shown by a flattening curve.
- When the curve flattens completely, the reaction has stopped.
- Comparing two reactions on one graph: steeper slope means faster reaction.
- Tangents can be drawn to measure the slope more accurately.
- Tangent lines help determine the rate of reaction at specific points.
- Drawing tangents involves using a ruler to touch the curve at the point of interest without cutting through the graph.
- Transparent rulers can help in drawing accurate tangents.
- Exam questions will allow some leeway in drawing tangents.
Please subscribe to access these revision notes.
This, and all other video notes, are included in our premium subscriptions.
Premium accounts get access to all videos and revision notes.
46
questions for The rate and extent of chemical change
46
questions for Rate of reaction