
GCSE Combined Science (AQA)
622 videos | 38 hours
Please subscribe to watch this video.
This, and all other videos, are included in our premium subscriptions.
Premium accounts get access to all videos.
Enable autoplay to keep watching
Your browser is blocking videos from playing automatically. To turn it back on:
Safari (Mac): Click the Safari menu item in the top bar, then Settings → Websites → Auto-Play, then set Auto-Play to Allow All Auto-Play for the current website.
Safari (iPhone/iPad): open the Settings app, then Apps → Safari → Auto-Play, and select Allow All Auto-Play.
Velocity-Time Graphs
- A velocity-time graph shows how an object's velocity changes over time.
- These graphs can represent various moving objects, such as car journeys or races.
- The X-axis represents time, and the Y-axis represents velocity.
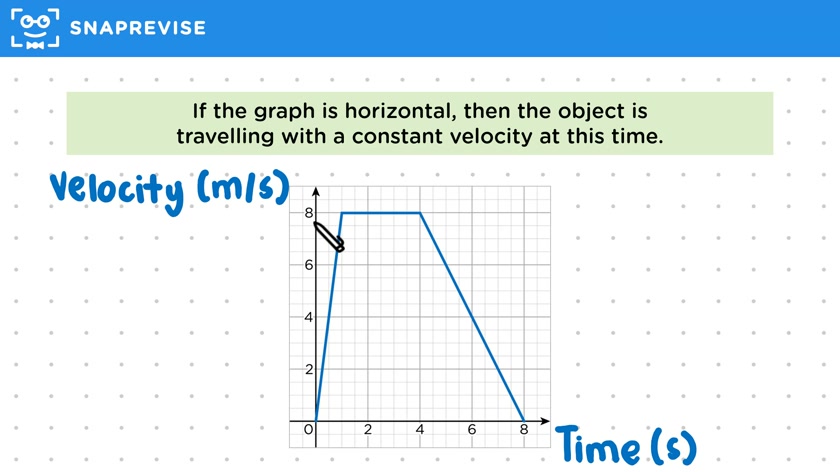
- Example: A bird's velocity increases as it gains speed, remains constant for a while, then decreases.
- Each point on the graph indicates the velocity at a specific time.
- Positive and negative velocities can be shown, with negative velocities appearing below the X-axis.
- The gradient of the graph indicates acceleration or deceleration.
- A steeper gradient signifies a greater magnitude of acceleration.
- A flat section on the graph indicates constant velocity, not a stationary object.
- Positive gradient = acceleration; negative gradient = deceleration.
- In exams, explain velocity-time graphs both qualitatively and mathematically.
- Compare graphs by steepness and height to determine acceleration and top speed.
- Sprinter example: Steeper graph = greater acceleration; higher graph = faster top speed.
- Aim for one key point per mark available in exam questions.
Please subscribe to access these revision notes.
This, and all other video notes, are included in our premium subscriptions.
Premium accounts get access to all videos and revision notes.
114
questions for Forces
95
questions for Forces and motion