
GCSE Maths (Edexcel)
435 videos | 33 hours
Please subscribe to watch this video.
This, and all other videos, are included in our premium subscriptions.
Premium accounts get access to all videos.
Enable autoplay to keep watching
Your browser is blocking videos from playing automatically. To turn it back on:
Safari (Mac): Click the Safari menu item in the top bar, then Settings → Websites → Auto-Play, then set Auto-Play to Allow All Auto-Play for the current website.
Safari (iPhone/iPad): open the Settings app, then Apps → Safari → Auto-Play, and select Allow All Auto-Play.
Causation
- Causation is when changing one variable affects another variable
- Bi-variate data is created by measuring two things from each item in a sample
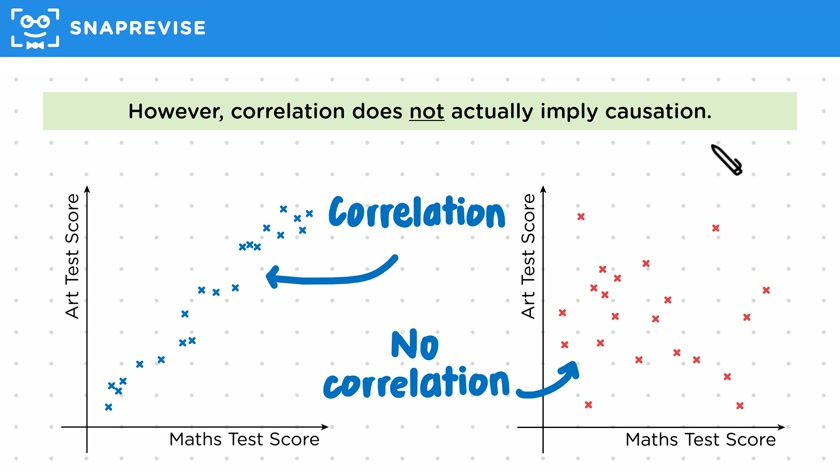
- Scatterplots can show if there is a correlation between two variables
- Correlation does not imply causation
- Correlation can provide evidence to back up a theory
- No correlation suggests no causation between two variables
- Common causes can create a correlation between two events
- Correlation can be found by coincidence
- Larger samples reduce the chance of finding a correlation by coincidence
- Extra data does not help identify a potential common cause behind a correlation
Please subscribe to access these revision notes.
This, and all other video notes, are included in our premium subscriptions.
Premium accounts get access to all videos and revision notes.
116
questions for Statistics
116
questions for Statistics