
GCSE Physics (AQA)
346 videos | 23 hours
Please subscribe to watch this video.
This, and all other videos, are included in our premium subscriptions.
Premium accounts get access to all videos.
Enable autoplay to keep watching
Your browser is blocking videos from playing automatically. To turn it back on:
Safari (Mac): Click the Safari menu item in the top bar, then Settings → Websites → Auto-Play, then set Auto-Play to Allow All Auto-Play for the current website.
Safari (iPhone/iPad): open the Settings app, then Apps → Safari → Auto-Play, and select Allow All Auto-Play.
AC & DC Current Graphs
- Direct current (DC) flows in the same direction but may vary in magnitude.
- On a graph, DC is represented by plotting potential difference against time, with the positive direction above the graph.
- A basic DC is shown by a straight line, indicating constant potential difference over time.
- DC can change in potential difference but not direction, always remaining positive.
- Alternating current (AC) has a changing potential difference, represented by a wave-like graph.
- AC alternates between positive and negative values periodically.
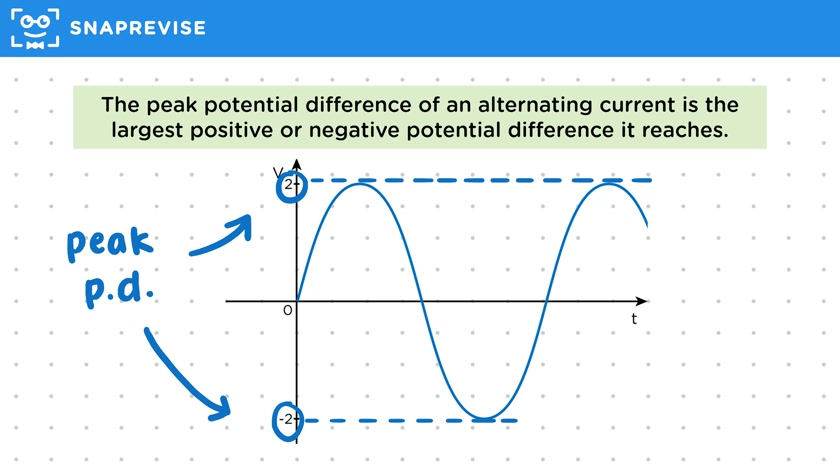
- Peak potential difference in AC is the largest positive or negative value reached.
- Peak potential difference can be identified on a graph by extending lines from the wave's peaks or troughs.
- AC alternates between positive and negative peak values, describing its behavior.
- Peak potential difference of AC is slightly higher than the equivalent DC potential difference.
- Equivalent DC is shown as a straight line on a graph, supplying the same power as the AC.
- Frequency of AC is the number of times the pattern repeats in one second.
- Frequency is measured in hertz (Hz), with one hertz equaling one cycle per second.
- Higher frequency indicates more pattern repetitions in a given time.
Please subscribe to access these revision notes.
This, and all other video notes, are included in our premium subscriptions.
Premium accounts get access to all videos and revision notes.
144
questions for Electricity
20
questions for Domestic uses and safety