
GCSE Physics (AQA)
346 videos | 23 hours
Please subscribe to watch this video.
This, and all other videos, are included in our premium subscriptions.
Premium accounts get access to all videos.
Enable autoplay to keep watching
Your browser is blocking videos from playing automatically. To turn it back on:
Safari (Mac): Click the Safari menu item in the top bar, then Settings → Websites → Auto-Play, then set Auto-Play to Allow All Auto-Play for the current website.
Safari (iPhone/iPad): open the Settings app, then Apps → Safari → Auto-Play, and select Allow All Auto-Play.
Area Under a Velocity-Time Graph
- The area under a velocity-time graph represents the distance traveled during that time.
- A velocity-time graph shows an object's velocity at each point in time, with the gradient indicating acceleration.
- A horizontal graph with no gradient indicates constant velocity and no acceleration.
- The relation between speed and distance is given by the equation: Speed = Distance / Time (V = S / T).
- Rearranging the equation gives VT = S, where V is velocity, T is time, and S is distance.
- For a constant velocity, the area under the graph (a rectangle) is calculated as base (T) times height (V), equating to distance (S).
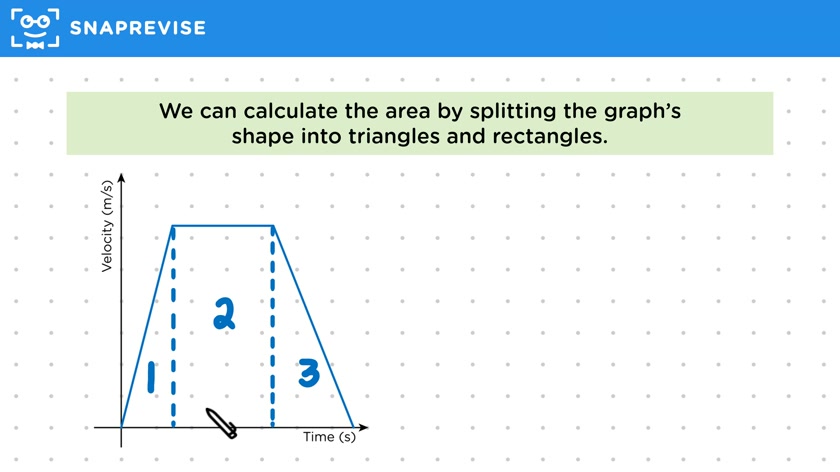
- For changing velocity, the area under the graph is found by dividing the shape into triangles and rectangles.
- The area of a triangle is calculated using 0.5 * base * height, and for a rectangle, it's base * height.
- In exams, you may need to calculate the area under a velocity-time graph to find the distance traveled.
- Example problem: Calculate the distance a dog runs using a velocity-time graph by splitting the graph into shapes and calculating each area.
- Steps include splitting the graph into triangles and rectangles, calculating each area, and summing them to find the total distance.
- Example calculation: Total distance = 7 meters (first triangle) + 10.5 meters (rectangle) + 12.25 meters (last triangle) = 29.75 meters.
Please subscribe to access these revision notes.
This, and all other video notes, are included in our premium subscriptions.
Premium accounts get access to all videos and revision notes.
153
questions for Forces
98
questions for Forces and motion