
GCSE Maths (Edexcel)
435 videos | 33 hours
Please subscribe to watch this video.
This, and all other videos, are included in our premium subscriptions.
Premium accounts get access to all videos.
Enable autoplay to keep watching
Your browser is blocking videos from playing automatically. To turn it back on:
Safari (Mac): Click the Safari menu item in the top bar, then Settings → Websites → Auto-Play, then set Auto-Play to Allow All Auto-Play for the current website.
Safari (iPhone/iPad): open the Settings app, then Apps → Safari → Auto-Play, and select Allow All Auto-Play.
Algebra
Graphs
Acceleration from Velocity-Time Graphs
5:55
Kinematic Graphs
Spec
A15
- The acceleration of an object at a point in time can be determined by calculating the gradient of its velocity time graph at that point.
- Velocity is a measure of how fast an object is traveling and can be positive or negative.
- The gradient of a velocity time graph represents the object's acceleration.
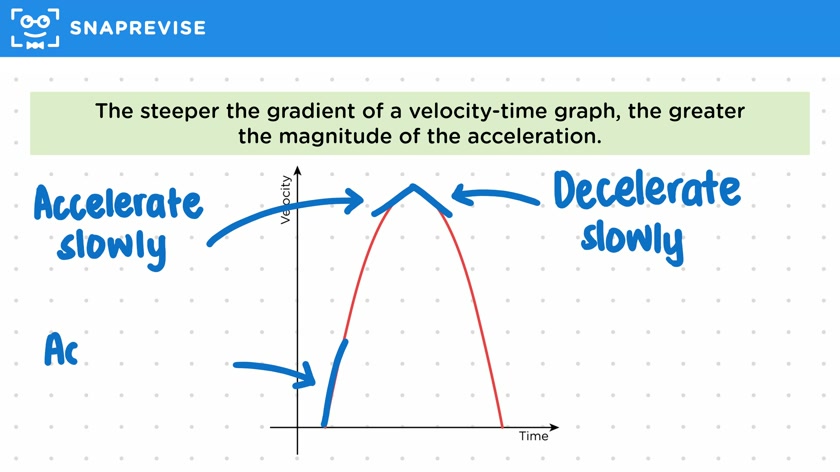
- The steeper the gradient of the graph, the greater the magnitude of the acceleration.
- The acceleration at any given point on the curve is given by the instantaneous gradient, which is the gradient of the tangent line.
- A positive gradient indicates acceleration, while a negative gradient indicates deceleration.
- The object starts with a velocity of zero and accelerates quickly, then the acceleration decreases until it starts decelerating.
- To calculate average deceleration, mark the points on the graph and draw a chord between them. The gradient of the chord represents the average deceleration.
- The units of acceleration are meters per second squared.
Please subscribe to access these revision notes.
This, and all other video notes, are included in our premium subscriptions.
Premium accounts get access to all videos and revision notes.
310
questions for Algebra
95
questions for Graphs
Report an Issue
Spotted something wrong? Let us know and we'll take a look.