
GCSE Maths (Edexcel)
435 videos | 33 hours
Please subscribe to watch this video.
This, and all other videos, are included in our premium subscriptions.
Premium accounts get access to all videos.
Enable autoplay to keep watching
Your browser is blocking videos from playing automatically. To turn it back on:
Safari (Mac): Click the Safari menu item in the top bar, then Settings → Websites → Auto-Play, then set Auto-Play to Allow All Auto-Play for the current website.
Safari (iPhone/iPad): open the Settings app, then Apps → Safari → Auto-Play, and select Allow All Auto-Play.
Comparing Data Sets
- Comparing datasets is a common type of GCSE question
- When comparing datasets, it is useful to look at notable differences in frequencies and proportions
- Pie charts can show the proportion of different categories in a dataset
- Comparisons can be made between very large and very small values, as well as values that change a lot or don't change at all
- Highest and lowest values can be compared between datasets
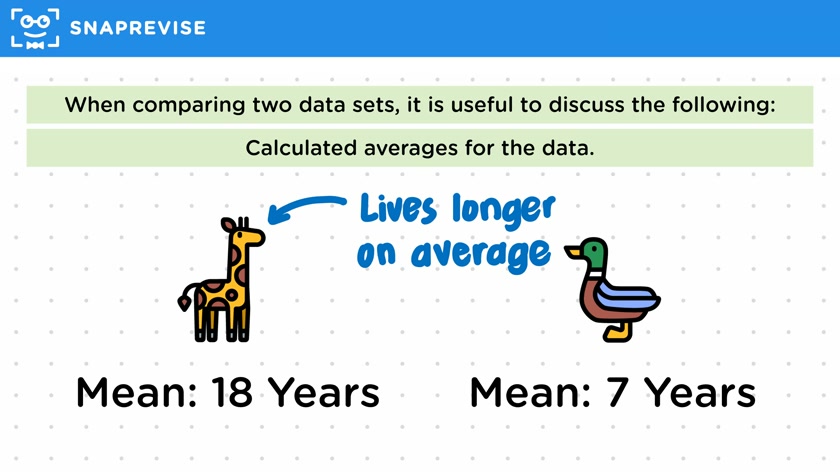
- Calculating and comparing averages (mean, median, mode) can provide information about central tendency
- The range of the data (difference between largest and smallest values) can be compared
- The spread or distribution of data values within the range can be compared
- Comparisons can be made between whether values are generally large or small
- Usually, two to three key points are enough for a comparison question, based on the number of marks available.
Please subscribe to access these revision notes.
This, and all other video notes, are included in our premium subscriptions.
Premium accounts get access to all videos and revision notes.
116
questions for Statistics
116
questions for Statistics