
GCSE Maths (Edexcel)
435 videos | 33 hours
Please subscribe to watch this video.
This, and all other videos, are included in our premium subscriptions.
Premium accounts get access to all videos.
Enable autoplay to keep watching
Your browser is blocking videos from playing automatically. To turn it back on:
Safari (Mac): Click the Safari menu item in the top bar, then Settings → Websites → Auto-Play, then set Auto-Play to Allow All Auto-Play for the current website.
Safari (iPhone/iPad): open the Settings app, then Apps → Safari → Auto-Play, and select Allow All Auto-Play.
Statistics
Statistics
Estimations from Histograms
3:50
Histograms
Spec
S3
S4
- Histograms are used to estimate the frequency of data within a given range
- The area of a group in a histogram represents the number of data values within that group
- The estimate of frequency in a given range is found by calculating the area in that section of the histogram
- The method of estimating frequency assumes that the data is evenly distributed within the groups
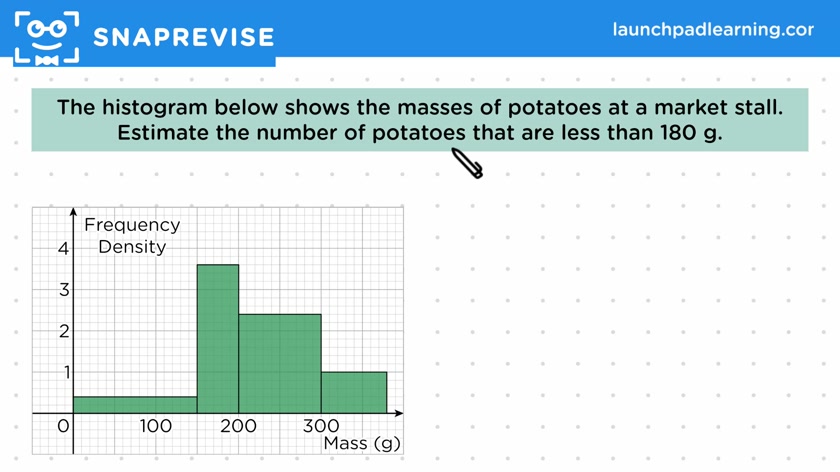
- To estimate the number of potatoes less than 180 grams, mark the required region on the histogram
- Calculate the frequency of the first part of the region by multiplying the class width by the frequency density
- Calculate the frequency of the second part of the region by multiplying the width by the frequency density
- Add the frequencies together to find the total frequency estimate
Please subscribe to access these revision notes.
This, and all other video notes, are included in our premium subscriptions.
Premium accounts get access to all videos and revision notes.
Report an Issue
Spotted something wrong? Let us know and we'll take a look.