
GCSE Maths (Edexcel)
435 videos | 33 hours
Please subscribe to watch this video.
This, and all other videos, are included in our premium subscriptions.
Premium accounts get access to all videos.
Enable autoplay to keep watching
Your browser is blocking videos from playing automatically. To turn it back on:
Safari (Mac): Click the Safari menu item in the top bar, then Settings → Websites → Auto-Play, then set Auto-Play to Allow All Auto-Play for the current website.
Safari (iPhone/iPad): open the Settings app, then Apps → Safari → Auto-Play, and select Allow All Auto-Play.
Frequency Venn Diagrams
- Venn diagrams can be constructed by writing the number of items in each region
- Example of sorting cards into sets using a Venn diagram
- Need to recognize when a Venn diagram is listing individual items or giving the number of items in a set
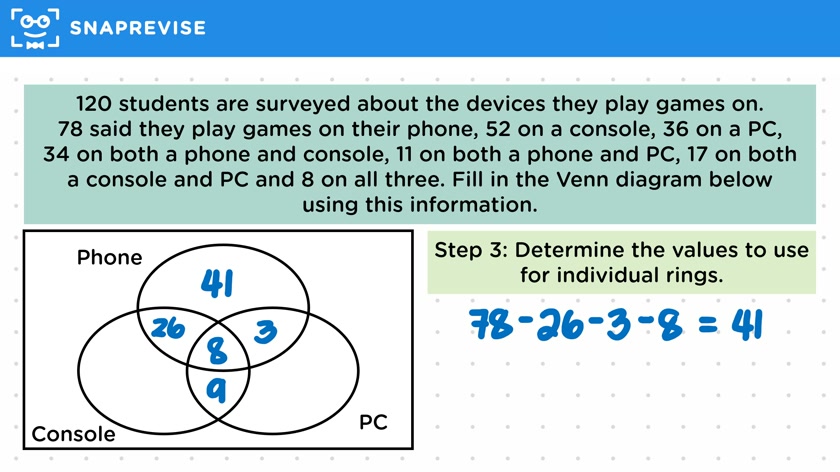
- Example of filling in a Venn diagram using survey data
- Steps to fill in a Venn diagram: fill in the intersection, determine values for two-ring intersections, determine values for individual rings, subtract values from total to find value outside the rings
- Listing frequencies in a Venn diagram is useful for finding probabilities and relative frequencies
- Example of using a Venn diagram to calculate probability
- Example of using a Venn diagram to calculate probability of a given event
Please subscribe to access these revision notes.
This, and all other video notes, are included in our premium subscriptions.
Premium accounts get access to all videos and revision notes.
68
questions for Probability
68
questions for Probability