
GCSE Maths (Edexcel)
435 videos | 33 hours
Please subscribe to watch this video.
This, and all other videos, are included in our premium subscriptions.
Premium accounts get access to all videos.
Enable autoplay to keep watching
Your browser is blocking videos from playing automatically. To turn it back on:
Safari (Mac): Click the Safari menu item in the top bar, then Settings → Websites → Auto-Play, then set Auto-Play to Allow All Auto-Play for the current website.
Safari (iPhone/iPad): open the Settings app, then Apps → Safari → Auto-Play, and select Allow All Auto-Play.
Grouped Data
- Frequency tables are used to show the number of times each data value occurs in a dataset
- Creating a frequency table for large sets of discrete numerical data with many possible numbers can be difficult
- A grouped frequency table is a better way to represent this type of data
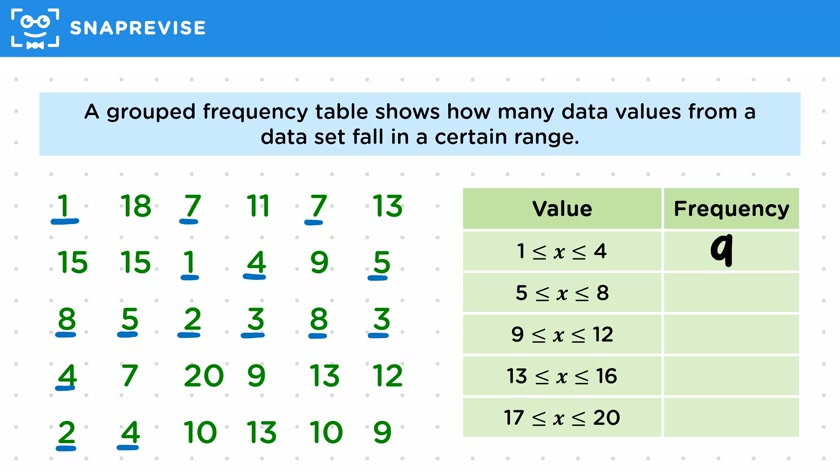
- A grouped frequency table shows how many data values fall within a certain range
- Grouped frequency tables are useful for both numerical and continuous data
- In a grouped frequency table, the ranges for the data values are evenly spaced or chosen to show trends more easily
- Grouped frequency tables are the only type of frequency table that can be used to show the frequencies of continuous data
- In a grouped frequency table, the frequencies are counted by counting the number of data values in each range
- Grouped frequency tables provide a clearer picture of the spread of the data and make it easier to identify patterns or trends
Please subscribe to access these revision notes.
This, and all other video notes, are included in our premium subscriptions.
Premium accounts get access to all videos and revision notes.
116
questions for Statistics
116
questions for Statistics