
GCSE Maths (Edexcel)
435 videos | 33 hours
Please subscribe to watch this video.
This, and all other videos, are included in our premium subscriptions.
Premium accounts get access to all videos.
Enable autoplay to keep watching
Your browser is blocking videos from playing automatically. To turn it back on:
Safari (Mac): Click the Safari menu item in the top bar, then Settings → Websites → Auto-Play, then set Auto-Play to Allow All Auto-Play for the current website.
Safari (iPhone/iPad): open the Settings app, then Apps → Safari → Auto-Play, and select Allow All Auto-Play.
Line of Best Fit
- Scatter diagrams are used to represent bivariate data
- The line of best fit is a straight line that describes the correlation of the data
- The line of best fit can show if there is a positive or negative correlation between the variables
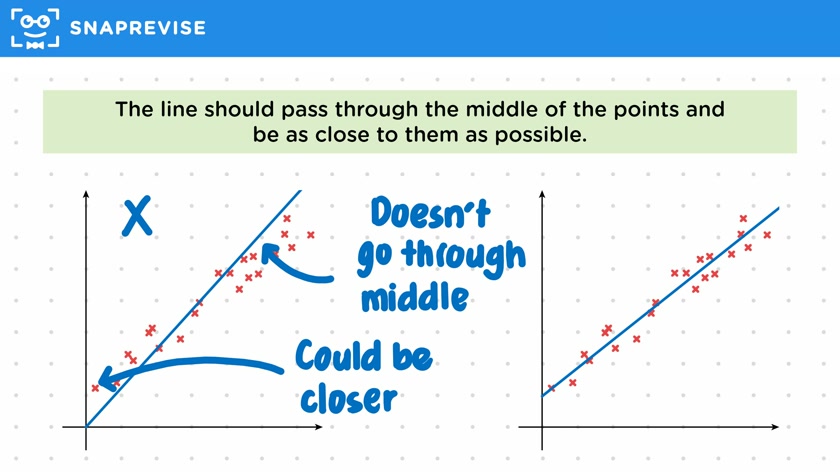
- The line of best fit should pass through the middle of the points and be as close to them as possible
- Computers can determine the best possible best fit line, but at GCSE level, it is only expected to be drawn by eye
- The line of best fit does not have to go through the origin
- Stronger correlations make it easier to draw the line of best fit
- A line of best fit cannot be drawn when there is no correlation between the variables
Please subscribe to access these revision notes.
This, and all other video notes, are included in our premium subscriptions.
Premium accounts get access to all videos and revision notes.
116
questions for Statistics
116
questions for Statistics