
GCSE Maths (Edexcel)
435 videos | 33 hours
Please subscribe to watch this video.
This, and all other videos, are included in our premium subscriptions.
Premium accounts get access to all videos.
Enable autoplay to keep watching
Your browser is blocking videos from playing automatically. To turn it back on:
Safari (Mac): Click the Safari menu item in the top bar, then Settings → Websites → Auto-Play, then set Auto-Play to Allow All Auto-Play for the current website.
Safari (iPhone/iPad): open the Settings app, then Apps → Safari → Auto-Play, and select Allow All Auto-Play.
Stem-and-Leaf Diagrams
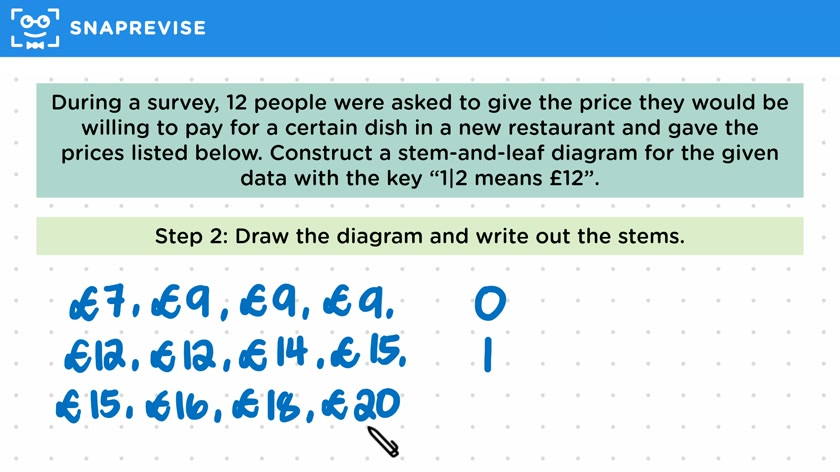
- A stem and leaf diagram shows the distribution and individual values of a discrete numerical data set
- The stems are the single numbers to the left of the vertical line, and the leaves are the numbers to the right
- The stem and leaf diagram provides a quick way of seeing the distribution of numbers in a set
- Each digit to the right of the line represents a data value, and a key is used to translate the meaning of each digit
- Different stem and leaf diagrams can have different kinds of keys
- To construct a stem and leaf diagram, the data values are written in order and the stems and leaves are filled out accordingly
- Back to back stem and leaf diagrams compare the data values from two sets of discrete numerical data
- The leaves are organized so the values increase as we move away from the central stem
- Back to back stem and leaf diagrams can show trends between the two groups being compared
- To compare the performances of two schools using a stem and leaf diagram, the spread of data and the highest and lowest scores can be analyzed
Please subscribe to access these revision notes.
This, and all other video notes, are included in our premium subscriptions.
Premium accounts get access to all videos and revision notes.
116
questions for Statistics
116
questions for Statistics