
GCSE Maths (Edexcel)
435 videos | 33 hours
Please subscribe to watch this video.
This, and all other videos, are included in our premium subscriptions.
Premium accounts get access to all videos.
Enable autoplay to keep watching
Your browser is blocking videos from playing automatically. To turn it back on:
Safari (Mac): Click the Safari menu item in the top bar, then Settings → Websites → Auto-Play, then set Auto-Play to Allow All Auto-Play for the current website.
Safari (iPhone/iPad): open the Settings app, then Apps → Safari → Auto-Play, and select Allow All Auto-Play.
Time Series
- A time series is a set of numerical data based on measurements taken over a period of time
- Numerical data can be used to calculate averages and perform other calculations
- Time series data can be represented in a table, with the top row showing the different times the data were collected
- The data can be continuous or discrete, depending on the type of measurement
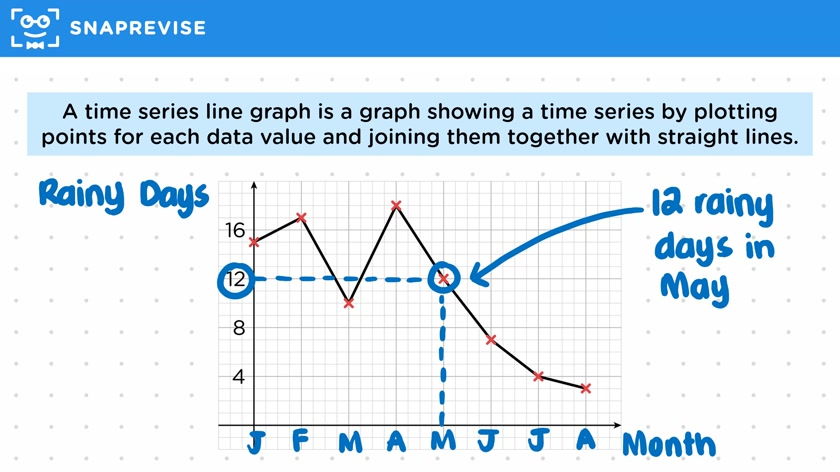
- A time series line graph is a graph that shows the data points for each time value and connects them with straight lines
- The vertical axis represents the type of data, while the horizontal axis represents the time
- Line graphs can help identify trends in the data
- To plot a time series line graph, a suitable scale for each axis should be chosen
- Each data point should be plotted on the graph by finding the corresponding time value and drawing a vertical line to the data point
- The points should then be connected with straight lines to complete the graph
- It is important to be able to both draw and analyze time series line graphs.
Please subscribe to access these revision notes.
This, and all other video notes, are included in our premium subscriptions.
Premium accounts get access to all videos and revision notes.
116
questions for Statistics
116
questions for Statistics