
GCSE Maths (AQA)
435 videos | 33 hours
Please subscribe to watch this video.
This, and all other videos, are included in our premium subscriptions.
Premium accounts get access to all videos.
Enable autoplay to keep watching
Your browser is blocking videos from playing automatically. To turn it back on:
Safari (Mac): Click the Safari menu item in the top bar, then Settings → Websites → Auto-Play, then set Auto-Play to Allow All Auto-Play for the current website.
Safari (iPhone/iPad): open the Settings app, then Apps → Safari → Auto-Play, and select Allow All Auto-Play.
Ratio, proportion and rates of change
Advanced Proportionality Graphs
4:16
Spec
3.3
- Graphs can be drawn to show the relation between a variable and a variable it is proportional to a power or root of.
- If two variables are proportional to each other, when one variable is multiplied, the other variable is multiplied by the same number.
- Algebraically, this can be written as y equals k x squared.
- The graph of y equals k x squared is a simple quadratic.
- As x increases, y increases, and the more x increases, the faster y increases.
- If y is proportional to x cubed, this can be written as y is kx cubed.
- When this equation is graphed, we get a simple cubic.
- Like a quadratic graph, as x increases, y increases. The larger the value of x, the more quickly y is increasing.
- This effect is even more noticeable with a cubic graph than a quadratic.
- You need to know the general shape and properties of all of the graphs encountered in this topic.
- However, you won't need to tell the difference between two similar looking graphs.
- For example, you need to know that a graph where y is proportional to x squared has a general shape.
- But you won't need to tell the difference between a quadratic and a cubic graph since they look so similar.
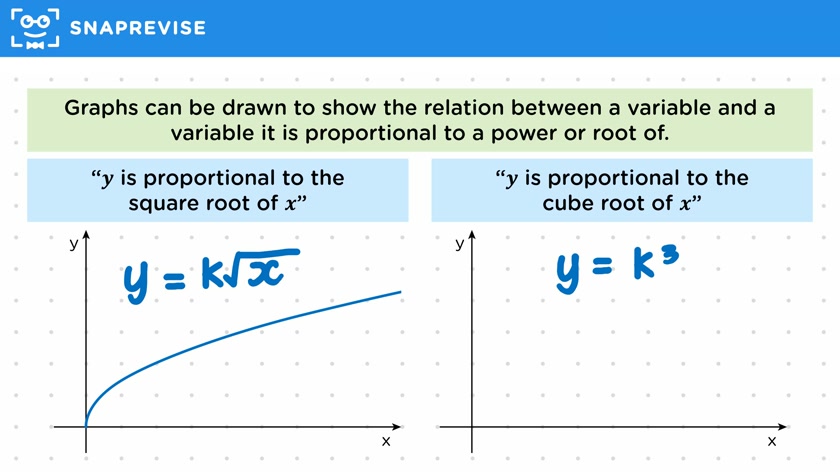
- If y is proportional to the square root of x, We can write the equation y is k root x.
- The graph of y is k root x looks like this.
- As x increases, y increases, but the larger the value of x, the more slowly y is increasing.
- If y is proportional to the cube root of x, we can write the equation y is k times the cube root of x.
- This gives us a very similar looking graph.
- As x increases, y increases. The larger the value of x, the slower y increases, causing the graph to flatten out.
- The graph of y is k times the cube root of x is even flatter than the graph of y is k times the square root of x.
- Graphs can also be drawn to show the relation between a variable and a variable it is inversely proportional to a power or root of.
- If two variables are inversely proportional, when one variable is multiplied by a number, the other variable is divided by that same number.
- If y is inversely proportional to x squared, this means we can write the equation y is k over x squared.
- The graph of this equation resembles a reciprocal graph that rises more sharply near the y axis.
- If cubed, we can write the equation y is k over x cubed.
- This graph also resembles the reciprocal graph, but it rises even more sharply near the y axis.
- If y is inversely proportional to the square root of x, we have the equation y is k over root x.
- Once again, this gives us a graph which looks like a reciprocal graph, but it doesn't go towards the x axis as quickly.
- If y is inversely proportional to the cube root of x, we have the equation y is k over the cube root of x.
- Again, we get something that looks like a reciprocal graph, but it goes towards the x axis even more slowly.
Please subscribe to access these revision notes.
This, and all other video notes, are included in our premium subscriptions.
Premium accounts get access to all videos and revision notes.
Report an Issue
Spotted something wrong? Let us know and we'll take a look.