
GCSE Maths (AQA)
435 videos | 33 hours
Please subscribe to watch this video.
This, and all other videos, are included in our premium subscriptions.
Premium accounts get access to all videos.
Enable autoplay to keep watching
Your browser is blocking videos from playing automatically. To turn it back on:
Safari (Mac): Click the Safari menu item in the top bar, then Settings → Websites → Auto-Play, then set Auto-Play to Allow All Auto-Play for the current website.
Safari (iPhone/iPad): open the Settings app, then Apps → Safari → Auto-Play, and select Allow All Auto-Play.
Statistics
Analysing Cumulative Frequency Graphs
6:23
Spec
3.6
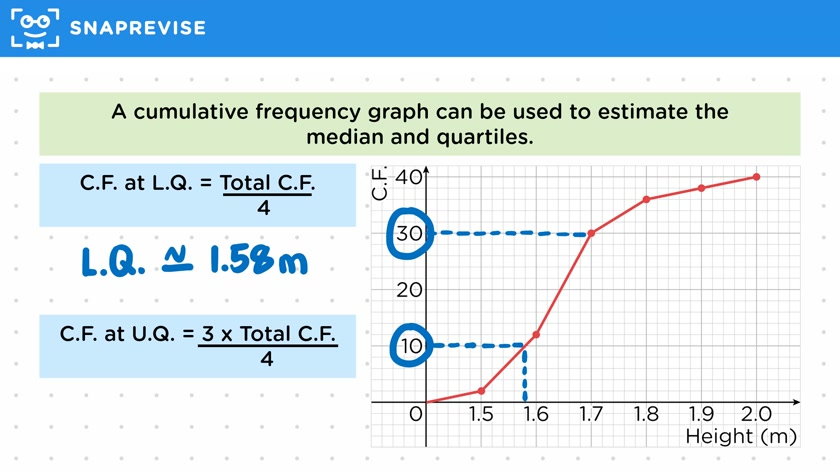
- Cumulative frequency graphs can be used to estimate the median and quartiles of a set of data
- The x coordinates of the points on the graph represent the end values of the data groups, while the y coordinates represent the frequency up to that point
- The cumulative frequency at the median is equal to the total cumulative frequency divided by 2
- The cumulative frequency at the lower quartile is equal to the total cumulative frequency divided by 4
- The cumulative frequency at the upper quartile is equal to three quarters of the total cumulative frequency
- To estimate the median, find the position on the y axis and draw a horizontal line to the graph, then draw a vertical line down to get the x coordinate
- To estimate the quartiles, follow the same process as for the median, but use the appropriate cumulative frequency (1/4 for lower quartile, 3/4 for upper quartile)
- The reverse process can also be used to estimate the cumulative frequency for a certain data value
- To estimate the cumulative frequency for a certain value, draw a vertical line from the value on the x axis and a horizontal line from where it meets the graph, then read the answer from the y axis
Please subscribe to access these revision notes.
This, and all other video notes, are included in our premium subscriptions.
Premium accounts get access to all videos and revision notes.
Report an Issue
Spotted something wrong? Let us know and we'll take a look.