
GCSE Maths (AQA)
435 videos | 33 hours
Please subscribe to watch this video.
This, and all other videos, are included in our premium subscriptions.
Premium accounts get access to all videos.
Enable autoplay to keep watching
Your browser is blocking videos from playing automatically. To turn it back on:
Safari (Mac): Click the Safari menu item in the top bar, then Settings → Websites → Auto-Play, then set Auto-Play to Allow All Auto-Play for the current website.
Safari (iPhone/iPad): open the Settings app, then Apps → Safari → Auto-Play, and select Allow All Auto-Play.
Change of Sign
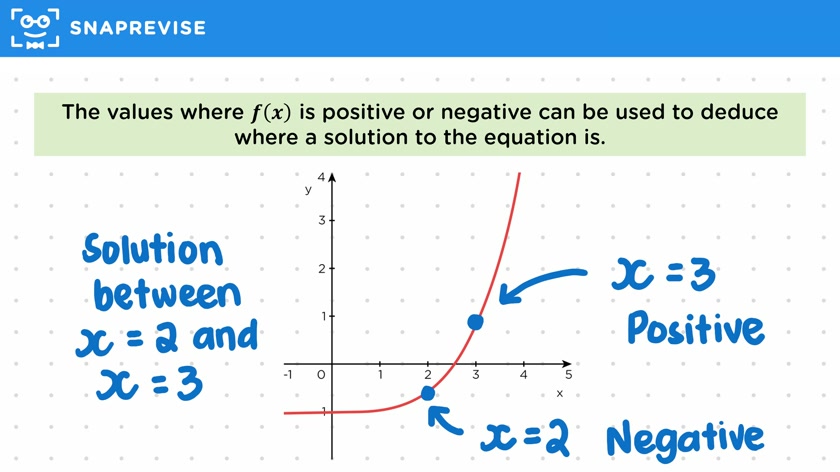
- The solution of an equation of the form f(x) = 0 is often a point where f(x) changes from positive to negative or vice versa.
- We can represent the function graphically by plotting the input values x on the x-axis and the output values f(x) on the y-axis.
- The graph of y = f(x) can be used to solve the equation f(x) = 0. Any point on the x-axis where y = 0 will give us a solution to the equation.
- The points immediately to the right of the solution are positive and the points immediately to the left are negative.
- By noticing where the function changes sign, we can deduce where a solution to the equation is.
- We can use the method of testing values on either side of the solution to find approximate solutions to equations we can't solve analytically.
- In the example given, the equation x^3 = x + 3 has a solution between x = 1 and x = 2 because the function changes sign somewhere in between.
Please subscribe to access these revision notes.
This, and all other video notes, are included in our premium subscriptions.
Premium accounts get access to all videos and revision notes.
310
questions for Algebra
83
questions for Solving equations and inequalities