
GCSE Maths (AQA)
435 videos | 33 hours
Please subscribe to watch this video.
This, and all other videos, are included in our premium subscriptions.
Premium accounts get access to all videos.
Enable autoplay to keep watching
Your browser is blocking videos from playing automatically. To turn it back on:
Safari (Mac): Click the Safari menu item in the top bar, then Settings → Websites → Auto-Play, then set Auto-Play to Allow All Auto-Play for the current website.
Safari (iPhone/iPad): open the Settings app, then Apps → Safari → Auto-Play, and select Allow All Auto-Play.
Direct Proportionality Graphs
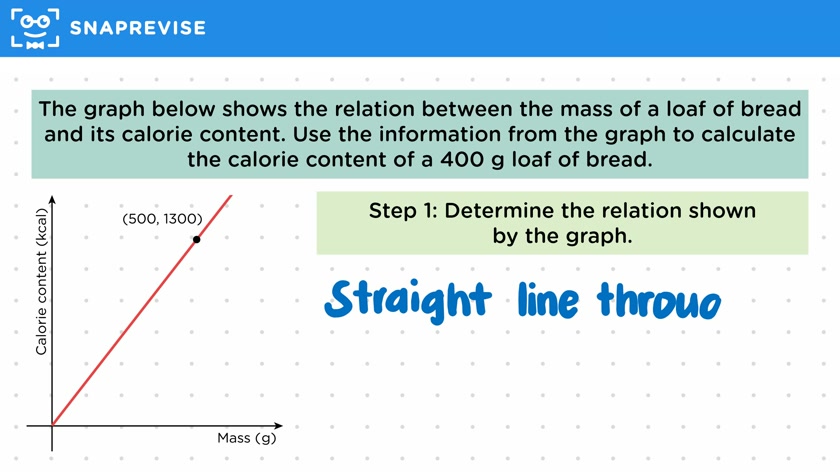
- The graph relating two proportional variables will be a straight line through the origin.
- The equation for a proportional relationship is y = kx + 0.
- The equation of a straight line is y = mx + c, where m is the gradient and c is the y intercept.
- It is important to be familiar with this relationship for exams and science subjects.
- The graph shows a directly proportional relationship between the mass of a loaf of bread and its calorie content.
- To calculate the calorie content of a 400 gram loaf of bread, divide 400 by 500 to get 0.8.
- Multiply the calorie content of 1,300 by 0.8 to get the required calorie content of 1,040 kilocalories.
Please subscribe to access these revision notes.
This, and all other video notes, are included in our premium subscriptions.
Premium accounts get access to all videos and revision notes.
75
questions for Ratio, proportion and rates of change
75
questions for Ratio, Proportion and Rates of Change