
GCSE Maths (AQA)
435 videos | 33 hours
Please subscribe to watch this video.
This, and all other videos, are included in our premium subscriptions.
Premium accounts get access to all videos.
Enable autoplay to keep watching
Your browser is blocking videos from playing automatically. To turn it back on:
Safari (Mac): Click the Safari menu item in the top bar, then Settings → Websites → Auto-Play, then set Auto-Play to Allow All Auto-Play for the current website.
Safari (iPhone/iPad): open the Settings app, then Apps → Safari → Auto-Play, and select Allow All Auto-Play.
Frequency Tables
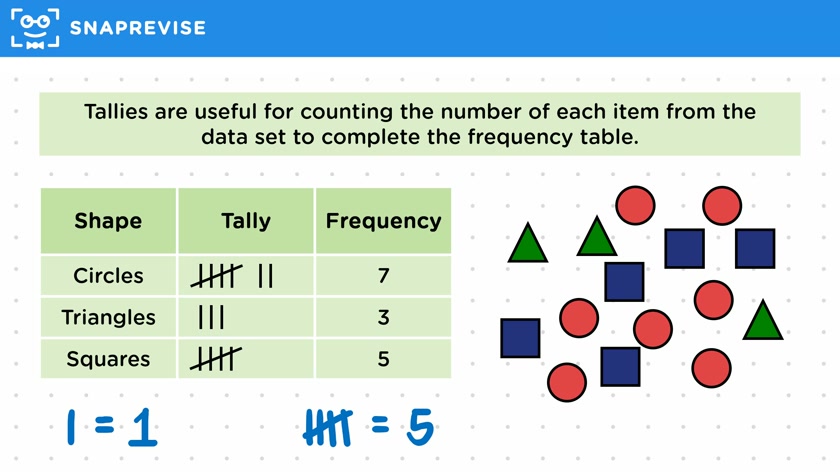
- A frequency table shows how often an item appears in a data set
- Data can be discrete, such as different shapes (square, circle, triangle)
- Tallies are useful for counting items in a data set
- Tallies are made by drawing vertical lines and crossing through every five
- Frequency tables can be completed by counting items using tallies
- Tally should always match the total frequency
- Tallies are a useful way to ensure accuracy in counting
- Frequency tables can also be used to read tallies
- Example given of completing a frequency table using tallies for dice rolls
- Step 1: Go through items and complete the tally
- Step 2: Add up the tallies to find the frequencies
Please subscribe to access these revision notes.
This, and all other video notes, are included in our premium subscriptions.
Premium accounts get access to all videos and revision notes.
116
questions for Statistics
116
questions for Statistics