
GCSE Maths (AQA)
435 videos | 33 hours
Please subscribe to watch this video.
This, and all other videos, are included in our premium subscriptions.
Premium accounts get access to all videos.
Enable autoplay to keep watching
Your browser is blocking videos from playing automatically. To turn it back on:
Safari (Mac): Click the Safari menu item in the top bar, then Settings → Websites → Auto-Play, then set Auto-Play to Allow All Auto-Play for the current website.
Safari (iPhone/iPad): open the Settings app, then Apps → Safari → Auto-Play, and select Allow All Auto-Play.
Statistics
Interpolation & Extrapolation
5:44
Spec
3.6
- Scatter diagrams can be used to plot bivariate data and show the relationship between two variables.
- A line of best fit can be drawn on a scatter diagram to predict the value of one variable if the other variable is known.
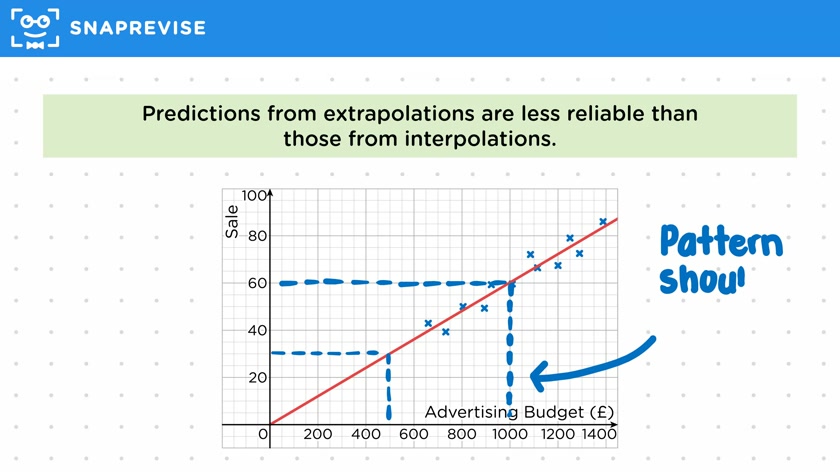
- Interpolation is a prediction within the range of given data, while extrapolation is a prediction outside the range of given data.
- Predictions from interpolations are more reliable than predictions from extrapolations.
- The strength of the correlation between variables affects the accuracy of the estimate.
- An interpolation is still an estimate and there may be some variation from the line of best fit.
- Extrapolations assume that the pattern shown by existing data holds in a different part of the graph, which may not always be reliable.
- It is important to be able to use scatter diagrams to make estimates and critique them based on whether they are interpolations or extrapolations.
- When estimating the average rating for a given number of cancellations, a line of best fit is drawn and a vertical line is drawn from the given value to the line of best fit.
- A horizontal line is then drawn to the axis to read the estimated value.
- If the given value is outside the range of the given data, the estimate is an extrapolation and may not be reliable.
Please subscribe to access these revision notes.
This, and all other video notes, are included in our premium subscriptions.
Premium accounts get access to all videos and revision notes.
Report an Issue
Spotted something wrong? Let us know and we'll take a look.