
GCSE Maths (AQA)
435 videos | 33 hours
Please subscribe to watch this video.
This, and all other videos, are included in our premium subscriptions.
Premium accounts get access to all videos.
Enable autoplay to keep watching
Your browser is blocking videos from playing automatically. To turn it back on:
Safari (Mac): Click the Safari menu item in the top bar, then Settings → Websites → Auto-Play, then set Auto-Play to Allow All Auto-Play for the current website.
Safari (iPhone/iPad): open the Settings app, then Apps → Safari → Auto-Play, and select Allow All Auto-Play.
Linear Inequality Graphs
- Graphs can be used to show linear inequalities in terms of two variables
- The boundary of the shaded region is a straight line graph derived from the inequality
- The line represents where the two sides of the inequality are equal to each other
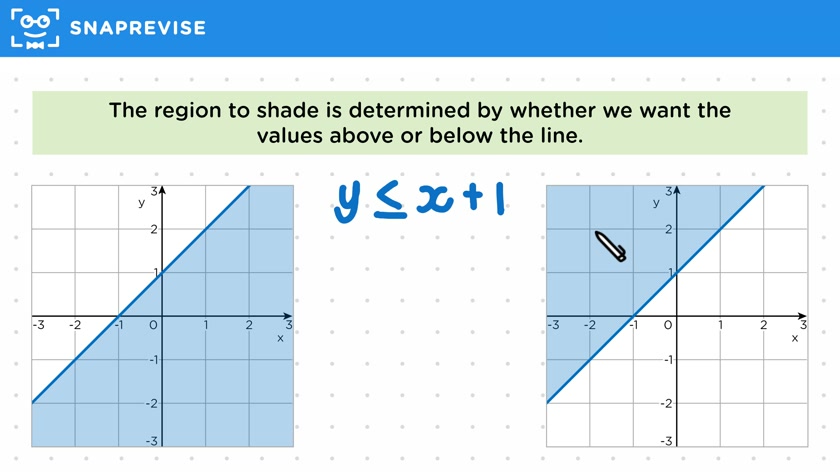
- One side of the line represents values where y is greater than the inequality, and the other side represents values where y is less than the inequality
- The shaded region is determined by whether we want the values above or below the line
- Every point in the shaded section below the line represents points where y is less than the inequality
- Every point in the shaded section above the line represents points where y is greater than the inequality
- We can double check which region is which by substituting values into the inequality
- In the example given, a dotted line is used because the inequality uses a greater than symbol
- The boundary line is drawn using the equation y = 2x - 1
- The region to shade is above the line because we want y values to be greater than the inequality
Please subscribe to access these revision notes.
This, and all other video notes, are included in our premium subscriptions.
Premium accounts get access to all videos and revision notes.
310
questions for Algebra
83
questions for Solving equations and inequalities