
GCSE Maths (AQA)
435 videos | 33 hours
Please subscribe to watch this video.
This, and all other videos, are included in our premium subscriptions.
Premium accounts get access to all videos.
Enable autoplay to keep watching
Your browser is blocking videos from playing automatically. To turn it back on:
Safari (Mac): Click the Safari menu item in the top bar, then Settings → Websites → Auto-Play, then set Auto-Play to Allow All Auto-Play for the current website.
Safari (iPhone/iPad): open the Settings app, then Apps → Safari → Auto-Play, and select Allow All Auto-Play.
Probability
Probabilities from Venn Diagrams
9:07
Spec
3.5
- An event is a set of possible outcomes that match certain criteria
- The universal set contains all possible outcomes from other sets in a specific context
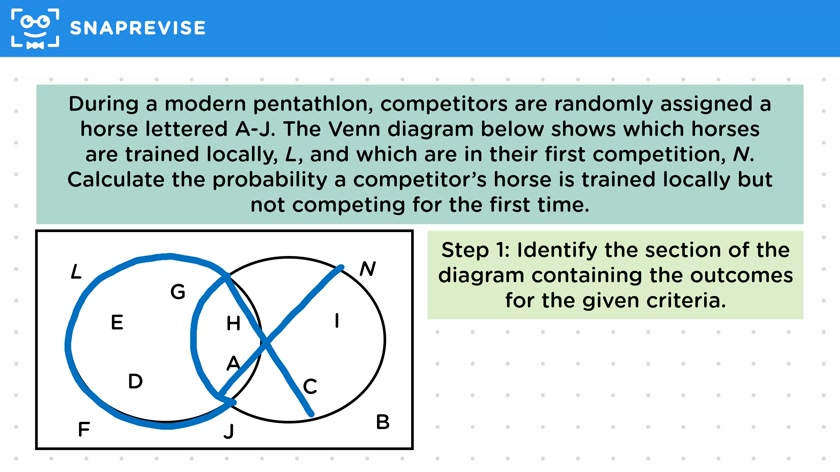
- Venn diagrams can be used to visualize sets and their intersections
- Probabilities can be calculated by finding the number of outcomes that satisfy certain criteria from the Venn diagram
- Example 1: Calculate the probability that a competitor's horse is trained locally, but not competing for the first time
- Example 2: Calculate the probability that a randomly generated three-digit number is both or neither even and more than 500
Please subscribe to access these revision notes.
This, and all other video notes, are included in our premium subscriptions.
Premium accounts get access to all videos and revision notes.
Report an Issue
Spotted something wrong? Let us know and we'll take a look.