
GCSE Maths (AQA)
435 videos | 33 hours
Please subscribe to watch this video.
This, and all other videos, are included in our premium subscriptions.
Premium accounts get access to all videos.
Enable autoplay to keep watching
Your browser is blocking videos from playing automatically. To turn it back on:
Safari (Mac): Click the Safari menu item in the top bar, then Settings → Websites → Auto-Play, then set Auto-Play to Allow All Auto-Play for the current website.
Safari (iPhone/iPad): open the Settings app, then Apps → Safari → Auto-Play, and select Allow All Auto-Play.
Range
- A measure of spread describes how varied the values in a data set are
- Measures of central tendency (mean, median, mode) describe the center of a data set
- It is best to include both a measure of central tendency and spread when summarizing a data set
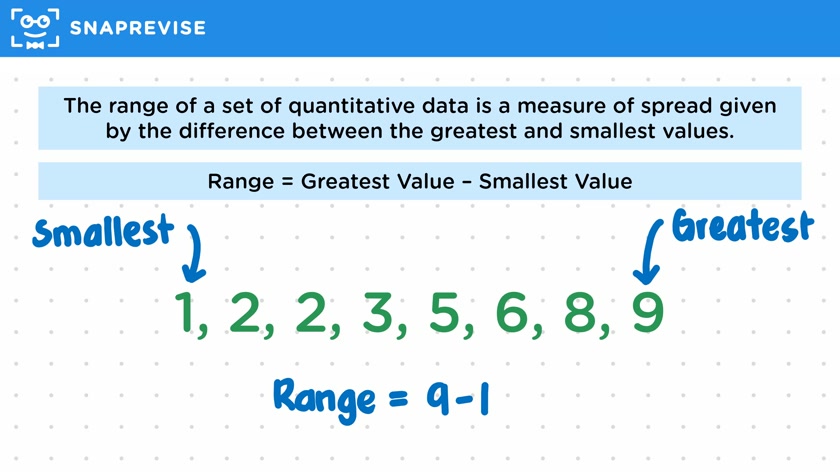
- The range is a measure of spread given by the difference between the greatest and smallest values in a data set
- The range is useful for quantitative data, but not for qualitative data
- The range can be calculated by subtracting the smallest value from the greatest value
- The range can also be deduced from a frequency table or a vertical line graph
- Range questions in exams may involve tables or charts to test understanding of different ways of presenting data
Please subscribe to access these revision notes.
This, and all other video notes, are included in our premium subscriptions.
Premium accounts get access to all videos and revision notes.
116
questions for Statistics
116
questions for Statistics