
GCSE Maths (AQA)
435 videos | 33 hours
Please subscribe to watch this video.
This, and all other videos, are included in our premium subscriptions.
Premium accounts get access to all videos.
Enable autoplay to keep watching
Your browser is blocking videos from playing automatically. To turn it back on:
Safari (Mac): Click the Safari menu item in the top bar, then Settings → Websites → Auto-Play, then set Auto-Play to Allow All Auto-Play for the current website.
Safari (iPhone/iPad): open the Settings app, then Apps → Safari → Auto-Play, and select Allow All Auto-Play.
Algebra
Graphs
Shape of an Exponential Graph
2:16
More Non-Linear Graphs
Spec
A12
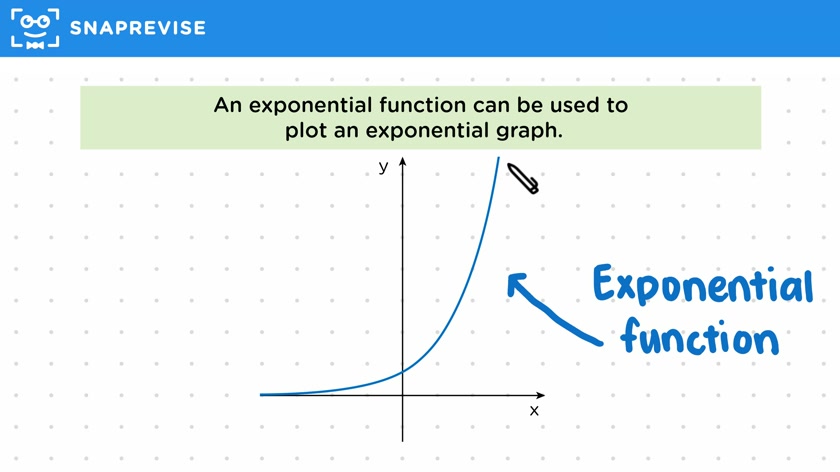
- Exponential functions include a term with a variable index
- Algebraically, exponential functions can be written as y = k^x, where k is a positive number and x is the variable index
- The graph of an exponential function is called an exponential graph
- When x is very negative, y is very close to zero
- As x increases, the y values also increase
- For positive values of x, the curve steeply increases
- The more positive x becomes, the more steeply y increases
- For negative values of x, the curve approaches zero but never quite reaches it
- The graph has a horizontal asymptote at y = 0, which is the algebraic form of the x axis.
Please subscribe to access these revision notes.
This, and all other video notes, are included in our premium subscriptions.
Premium accounts get access to all videos and revision notes.
310
questions for Algebra
95
questions for Graphs
Report an Issue
Spotted something wrong? Let us know and we'll take a look.