
GCSE Maths (AQA)
435 videos | 33 hours
Please subscribe to watch this video.
This, and all other videos, are included in our premium subscriptions.
Premium accounts get access to all videos.
Enable autoplay to keep watching
Your browser is blocking videos from playing automatically. To turn it back on:
Safari (Mac): Click the Safari menu item in the top bar, then Settings → Websites → Auto-Play, then set Auto-Play to Allow All Auto-Play for the current website.
Safari (iPhone/iPad): open the Settings app, then Apps → Safari → Auto-Play, and select Allow All Auto-Play.
The Sine Graph
- The trigonometric function y = sin(x) can be graphed as a sine graph
- The sine of x equals the opposite divided by the hypotenuse of a right angled triangle
- The sine of x can also be thought of as the y coordinate of a point on a unit circle x degrees anticlockwise from the positive x axis
- The graph of y = sin(x) extends from negative infinity to positive infinity, with y values ranging between -1 and 1
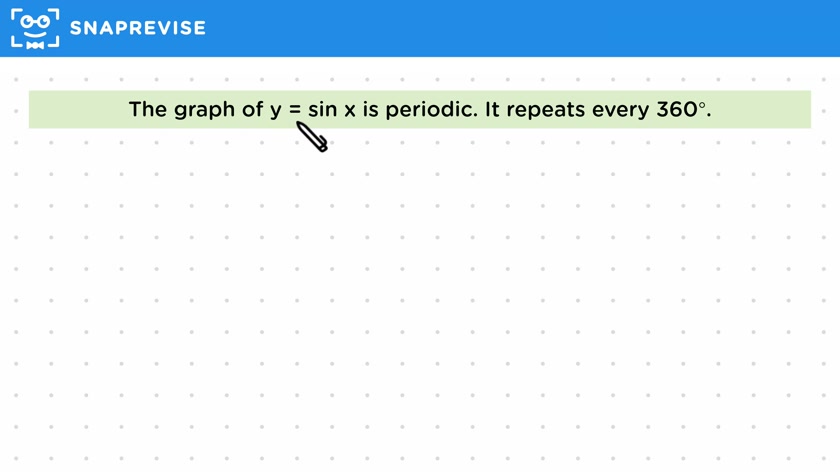
- The graph of y = sin(x) is periodic and repeats every 360 degrees
- The value of sin(x) at 450 degrees is -1, and this value repeats every 360 degrees
- The value of sin(x) at -450 degrees is also -1, and this value repeats every 360 degrees
- The graph of y = sin(x) is equal to sin(x + 360) and sin(x - 360)
- The graph of y = sin(x) is periodic every 360 degrees
Please subscribe to access these revision notes.
This, and all other video notes, are included in our premium subscriptions.
Premium accounts get access to all videos and revision notes.
372
questions for Geometry and measures
190
questions for Mensuration and calculation