
GCSE Maths (AQA)
435 videos | 33 hours
Please subscribe to watch this video.
This, and all other videos, are included in our premium subscriptions.
Premium accounts get access to all videos.
Enable autoplay to keep watching
Your browser is blocking videos from playing automatically. To turn it back on:
Safari (Mac): Click the Safari menu item in the top bar, then Settings → Websites → Auto-Play, then set Auto-Play to Allow All Auto-Play for the current website.
Safari (iPhone/iPad): open the Settings app, then Apps → Safari → Auto-Play, and select Allow All Auto-Play.
Uneven Histograms
- A histogram represents the frequency of data items within a continuous range
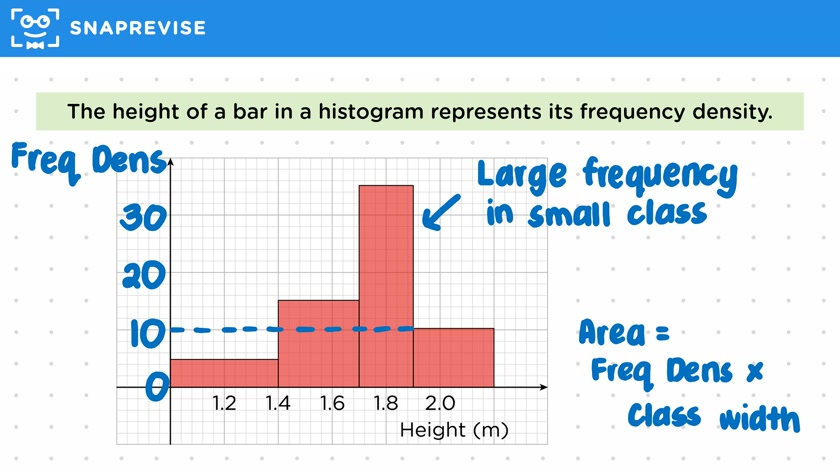
- The area of the bars in a histogram represents the frequency, not the height
- Frequency density is a measure of frequency per unit data in a class's range
- Frequency density is calculated by dividing the frequency by the class width
- The height of a bar in a histogram represents its frequency density
- The area of a bar in a histogram is equal to its height (frequency density) multiplied by its width (class width)
- Histograms help visualize both the frequencies and how densely packed they are
- If all class widths are the same, frequency can be plotted on the y-axis instead of frequency density
- To analyze an uneven histogram, determine the class ranges, calculate the frequency density, deduce the scale for the vertical axis, determine the frequency density and class width for each bar, and calculate the frequency for each bar.
Please subscribe to access these revision notes.
This, and all other video notes, are included in our premium subscriptions.
Premium accounts get access to all videos and revision notes.
116
questions for Statistics
116
questions for Statistics