
GCSE Physics (OCR A)
Topic Summaries
Science skills: Presenting and using data
Interpreting graphs
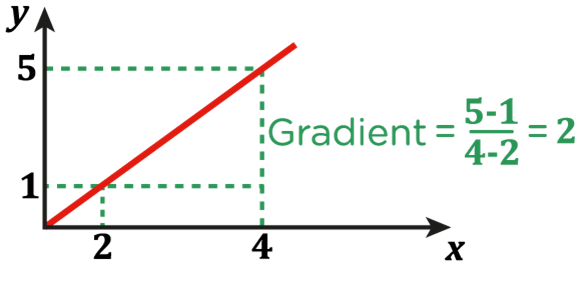
- The gradient of a straight line of best fit can give information about the relationship between two variables in a graph.
- To calculate the gradient, choose two points on the lines as far apart as possible such that their x and y values are easy to read and calculate the differences in the two x and the two y values. The gradient will be difference in y ÷ difference in x.
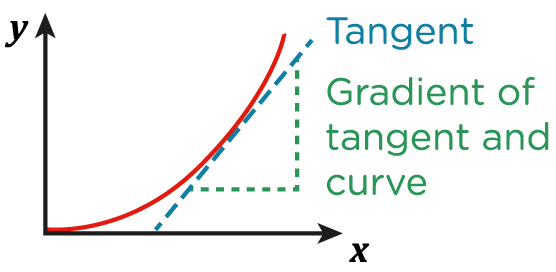
- A curved line of best fit has a changing gradient. The gradient at a particular point can be calculated by drawing a tangent.
- A tangent is a straight line that only just brushes against the point on the curve.
- The gradient of the curve is the gradient of this straight-line tangent.
- The x or y intercept is the point where the line crosses the x or y axis.
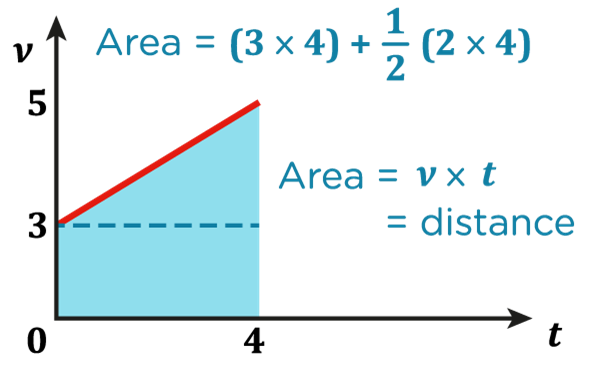
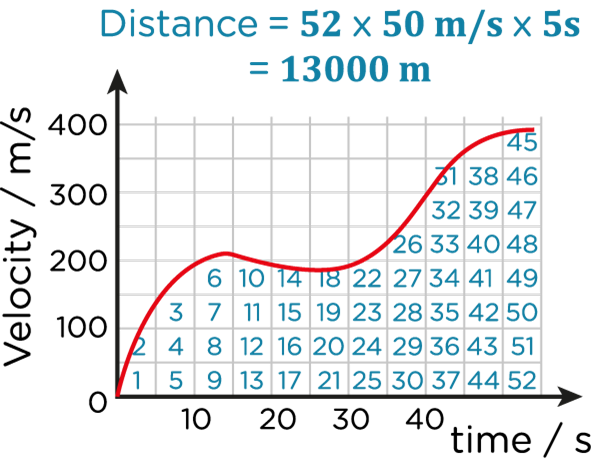
- The area under a line graph is the value that corresponds to multiplying together the two variables shown in the graph as they are both changing.
- For straight line graphs, this area can be calculated using the formula for the area of a rectangle or a triangle.
- For curves, this area can be estimated by counting the squares beneath the graph.
Unlock Interpreting graphs
Sign up to unlock the rest of this topic — plus every other topic, video, flashcard set and eBook guide in your SnapRevise Digital subscription.
Cancel anytime — instant access the moment you sign up.
Report an Issue
Spotted something wrong? Let us know and we'll take a look.