Topic Summaries
Interpreting graphs
Energy and power
Renewable energy and efficiency
Charge, current, and electric fields
Potential difference and resistors
Electricity
Volume and gases
States of matter and heat capacity
Radiation
Nuclear fusion and fission
Forces
Velocity and acceleration
Gravity and Newton's Laws
Moments and elastic potential
Stopping, braking, and momentum
Properties of waves
Electromagnetic waves
Refraction and lenses
Light, colour, and ray diagrams
Absorbing and emitting infrared radiation
Magnetic fields
Motor effect, generator effect, and transformers
Science skills: Experimental procedures
Science skills: Presenting and using data
Science skills: Measuring results
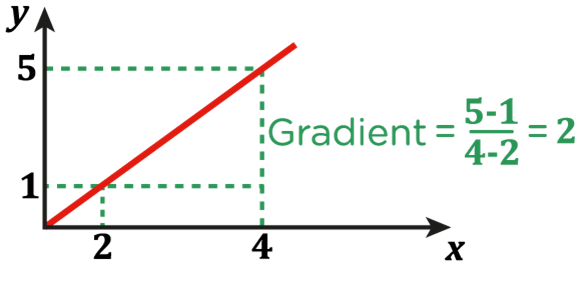
- The gradient of a straight line of best fit can give information about the relationship between two variables in a graph.
- To calculate the gradient, choose two points on the lines as far apart as possible such that their x and y values are easy to read and calculate the differences in the two x and the two y values. The gradient will be difference in y ÷ difference in x.
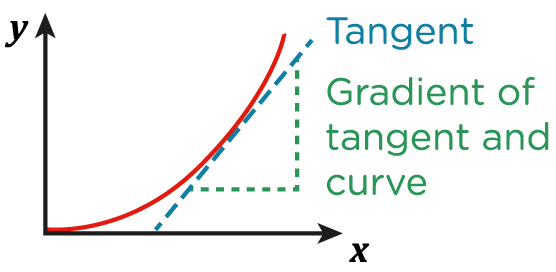
- A curved line of best fit has a changing gradient. The gradient at a particular point can be calculated by drawing a tangent.
- A tangent is a straight line that only just brushes against the point on the curve.
- The gradient of the curve is the gradient of this straight-line tangent.
- The x or y intercept is the point where the line crosses the x or y axis.
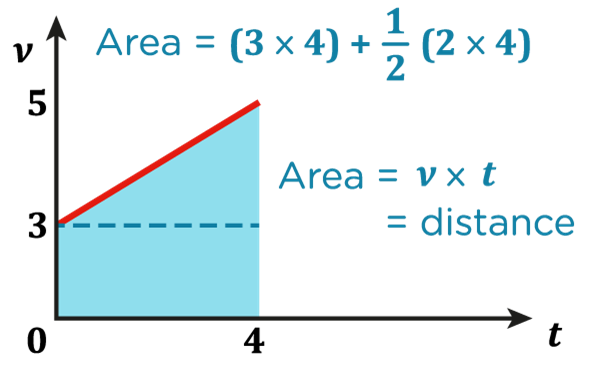
- The area under a line graph is the value that corresponds to multiplying together the two variables shown in the graph as they are both changing.
- For straight line graphs, this area can be calculated using the formula for the area of a rectangle or a triangle.
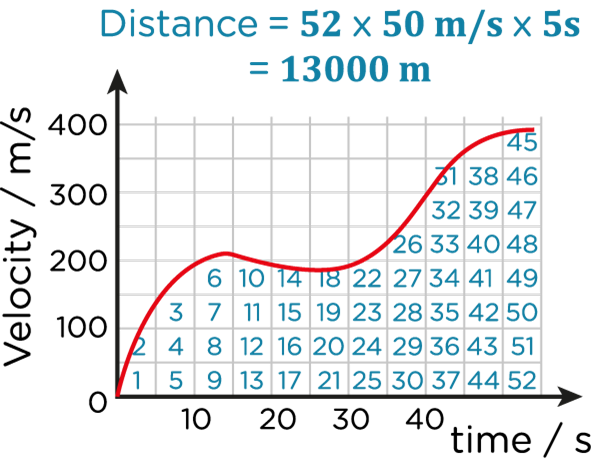
- For curves, this area can be estimated by counting the squares beneath the graph.
Unlock Interpreting graphs
Subscribe to SnapRevise+ to get immediate access to the rest of this resource.
Premium accounts get immediate access to this resource.