Topic Summaries
Velocity–time graphs (HT ONLY)
Energy and power
Renewable energy and efficiency
Charge, current, and electric fields
Potential difference and resistors
Electricity
Volume and gases
States of matter and heat capacity
Radiation
Nuclear fusion and fission
Forces
Velocity and acceleration
Gravity and Newton's Laws
Moments and elastic potential
Stopping, braking, and momentum
Properties of waves
Electromagnetic waves
Refraction and lenses
Light, colour, and ray diagrams
Absorbing and emitting infrared radiation
Magnetic fields
Motor effect, generator effect, and transformers
Science skills: Experimental procedures
Science skills: Presenting and using data
Science skills: Measuring results
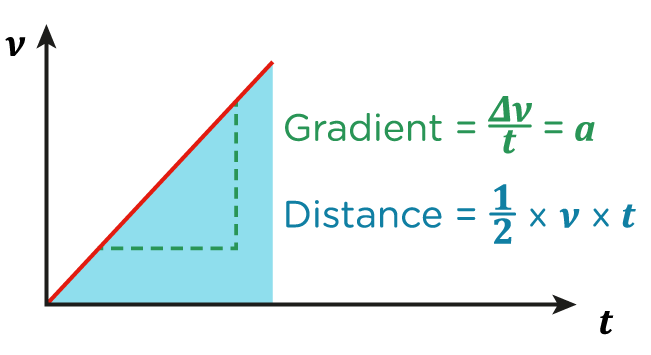
- A velocity-time graph shows how the velocity of an object changes with time.
- The acceleration of the object can be found by calculating the gradient of the graph.
- A steeper gradient means a greater acceleration.
- If the graph is horizontal, then the object is moving at a constant velocity.
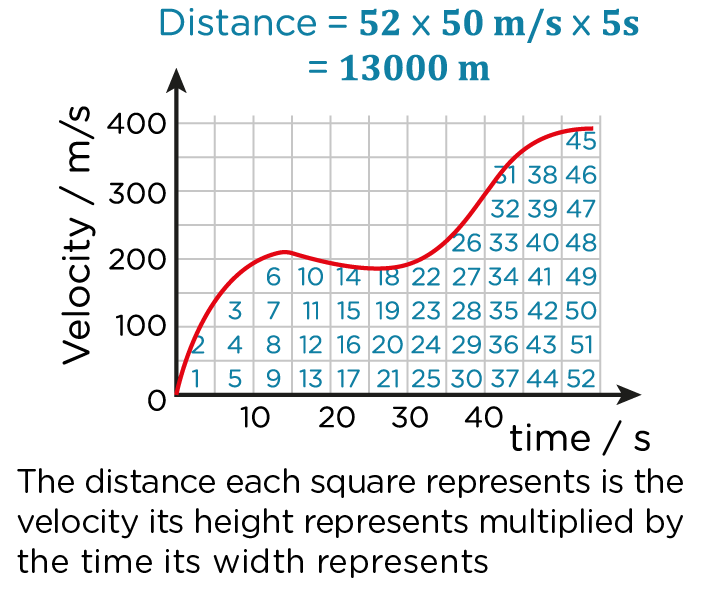
- The area under a velocity-time graph gives the distance travelled by an object.
- For straight graphs, this can be calculated as the area of multiple triangles and rectangles.
- For curved graphs, this distance can be estimated by counting the squares under the graph.
Unlock Velocity–time graphs (HT ONLY)
Subscribe to SnapRevise+ to get immediate access to the rest of this resource.
Premium accounts get immediate access to this resource.